Guangyuan(Frank) LiAs a postdoc, what I learned about mentoring peopleThe mistakes I made, the lessons I learned5 min read·Feb 3, 2024--9--9
Guangyuan(Frank) LiNetwork Analysis in PythonA comprehensive introduction and hands-on practice of graph theory and network analysis7 min read·Jun 20, 2023----
Guangyuan(Frank) LiRules for becoming a better bioinformatician in 2023Some observations as a trainee5 min read·Jan 30, 2023--1--1
Guangyuan(Frank) LiProbabilistic modeling in Python (not finished yet)Bayesian modeling and related12 min read·Jan 5, 2023----
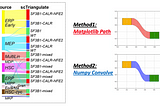
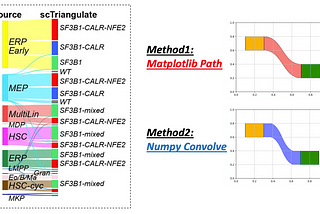
Guangyuan(Frank) LiinTowards Data ScienceThe essence of drawing Sankey PlotI would like to share two approaches to generating the most essential parts of a Sankey plot in pure Python6 min read·Oct 30, 2022----
Guangyuan(Frank) LiFAQs of academia versus industrySome thoughts after experiencing both sides6 min read·Jul 23, 2022----
Guangyuan(Frank) LiinTowards Data SciencePlotly meets Scientific VisualizationAlthough static plot is the default option for scientific presentation, interactivity has its own power8 min read·Feb 28, 2022----
Guangyuan(Frank) LiinTowards Data ScienceByte string, Unicode string, Raw string — A Guide to all strings in PythonDifferences, usages, Python versus NumPy versus Pandas?7 min read·Nov 14, 2021--1--1
Guangyuan(Frank) LiinTowards Data ScienceSimple steps to create custom colormaps in PythonCreating any colormap at your wills4 min read·Oct 25, 2021--2--2
Guangyuan(Frank) LiinTowards Data ScienceHow to learn MatlabAll you need to know to begin your Matlab journey7 min read·Jul 17, 2021--1--1